
kW vs Units (2026): How Much Rooftop Solar Generates in Hyderabad, Month by Month
A solar quote talks in kW, your bill in units. How many units each system size generates, how output changes across Hyderabad's year, and how to size a system from your bill.
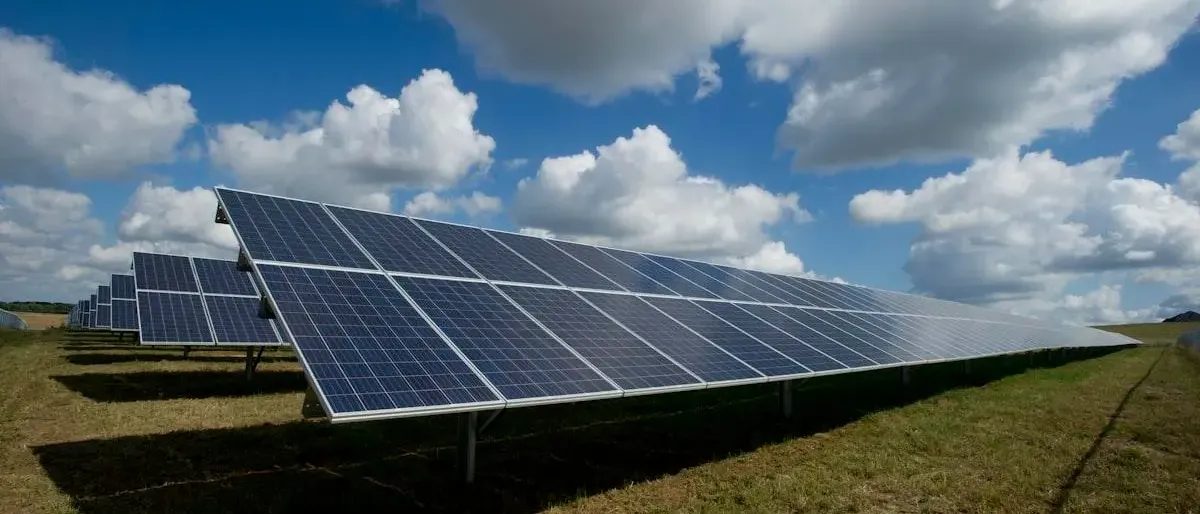
Quick answer: kW is the size of a solar system; a unit (kWh) is the energy it makes. In India, a 1 kW rooftop system typically generates about 4 to 5 units a day (Centre for Science and Environment), which is roughly 120 to 150 units a month. In Hyderabad, output peaks from February to May, dips in the monsoon (July and August are the lowest), and recovers from October. A 3 kW home system makes about 12 to 15 units on an average day, or roughly 4,400 to 5,500 units a year.
Solar quotes talk in kW. Your electricity bill talks in units. Most confusion about rooftop solar comes from mixing the two, and from expecting the same output every month. Here is how to convert one into the other, and what a Hyderabad rooftop actually does across the year.
kW and units: the difference in one minute
- kW (kilowatt), or kWp (kilowatt peak), is the rated size of the panels: what they can produce at one instant under standard test conditions.
- A unit is one kWh (kilowatt hour): 1,000 watts used for one hour. It is what your DISCOM meter counts and what your bill charges for.
A 1 kW system does not make 1 kW all day. Output starts near zero at sunrise, peaks around midday and falls again by evening. Added up, a typical Indian day gives 4 to 5 units per kW, a range the Centre for Science and Environment (CSE) uses in its consumer guide to rooftop solar. The World Bank's Global Solar Atlas, the tool CSE points readers to, puts Hyderabad's long-term average at about 5.3 peak sun hours a day, which is consistent with that range.
How much each system size generates
| System size | Units per day | Units per month (30 days) | Units per year |
| 1 kW | 4 to 5 | 120 to 150 | 1,460 to 1,825 |
| 2 kW | 8 to 10 | 240 to 300 | 2,920 to 3,650 |
| 3 kW | 12 to 15 | 360 to 450 | 4,380 to 5,475 |
| 5 kW | 20 to 25 | 600 to 750 | 7,300 to 9,125 |
| 10 kW | 40 to 50 | 1,200 to 1,500 | 14,600 to 18,250 |
These are annual averages for a well-installed, unshaded, south-facing system. For budgeting, plan on the lower end of the range: real rooftops lose a little to wiring, inverter conversion, dust and heat.
Month by month in Hyderabad
Solar output follows the weather more than the calendar. Hyderabad's pattern is shaped by two things: clear skies from November to May, and the south-west monsoon from June to September, when cloud cover rather than rain itself cuts the sunlight reaching the panels.
| Month | Normal rainfall, Hyderabad (mm) | Daylight | What to expect from your system |
| January | 8 | 11 h 12 m | Above average: clear and cool |
| February | 9 | 11 h 35 m | Above average |
| March | 17 | 12 h 01 m | Among the best months |
| April | 30 | 12 h 31 m | Among the best months, though heat trims panel efficiency |
| May | 34 | 12 h 56 m | High, but the hottest month and often dusty: clean the panels |
| June | 110 | 13 h 10 m | Falling as the monsoon arrives |
| July | 158 | 13 h 04 m | Low: long days but heavy cloud |
| August | 205 | 12 h 43 m | Lowest of the year, typically |
| September | 147 | 12 h 15 m | Low, improving late in the month |
| October | 119 | 11 h 46 m | Recovering; close to average |
| November | 21 | 11 h 20 m | Above average: clear skies return |
| December | 4 | 11 h 06 m | Good, on the shortest days of the year |
Rainfall: WMO climate normals for Hyderabad Airport (published by the Japan Meteorological Agency). Daylight: average day length for Hyderabad. The last column is an indicative guide, not a measured figure.
How big is the swing? A 2022 study in Frontiers in Energy Research of a 1 MWp rooftop plant at GITAM, Visakhapatnam, at almost the same latitude, simulated output of about 169 units per kWp in March against 118 in July: the best month made roughly 40% more than the worst. A 2014 study of solar potential across Telangana (Harinarayana and Kashyap, Smart Grid and Renewable Energy) also found generation lowest in July and August. Expect the same shape on a Hyderabad rooftop, even if your exact numbers differ.
What changes the units you actually get
- Direction and tilt. In Hyderabad, panels facing south at a modest tilt collect the most over the year. East or west facing roofs still work, with lower output.
- Shade. A water tank, parapet or neighbour's floor that shades even part of a string can pull down the output of the whole string.
- Dust. CSE notes that dirt can reduce generation by 30% or more if panels are not cleaned regularly. In the dry months before the monsoon, cleaning matters most.
- Heat. Panels lose a little efficiency as they get hotter. The temperature coefficient on the module datasheet tells you how much.
- Age. Output declines slowly over the years. The power output warranty sets the floor; our guide to reading a solar warranty explains how.
How to size a system from your bill
Work backwards from units. Take your average monthly consumption over the last 12 bills and divide by 120 (30 days at 4 units per kW per day, the conservative end). A home using 300 units a month needs about 2.5 kW, so a 3 kW system is the practical choice.
This lines up with the guidance under PM Surya Ghar: Muft Bijli Yojana, which suggests 1 to 2 kW for homes using up to 150 units a month, 2 to 3 kW for 150 to 300 units, and above 3 kW for higher use. Central financial assistance is capped at 3 kW. Sizing also has to fit your sanctioned load and the net metering limits set by TGERC; our TGSPDCL net metering guide covers the process.
Remember the seasons when you judge results. A system sized on the annual average will run ahead of your consumption in March and behind it in August. Compare a full year of generation, not one month.
Frequently asked questions
Does rooftop solar work during the monsoon?
Yes. Panels still generate under cloud, only less. July and August are typically the weakest months in Hyderabad, and the clear months make up for them over the year.
My generation dropped in May even though it was sunny. Why?
Usually heat and dust. Hot panels are slightly less efficient, and pre-monsoon dust builds up quickly. Clean the panels and compare with the same month last year.
Where do I see how many units my system made?
On the inverter display or its mobile app, and on your net meter, which records units imported from and exported to the grid. Your DISCOM bill shows both.
Generation figures here are typical ranges, not a guarantee for any specific roof, and scheme guidelines and net metering rules can be revised. This guide is current as of October 2026.
Want an estimate for your roof?
Greentek's Secunderabad team has designed and installed solar systems since 1997. Share your last few electricity bills and roof details, and we will estimate the units your rooftop can generate through the year.
About the Author
About Greentek
Get a Free Solar Quote
A Greentek engineer will call you within 24 hours.
Need Solar Solutions?
Interested in learning more about our solar energy solutions? Get in touch with our experts.
Get Free Consultation